Unlocking HR Success with Key Performance Indicators
Want to boost your HR impact? This listicle provides eight essential HR KPI examples to track in 2025. Learn how to measure vital metrics like employee turnover rate, time to fill, and cost per hire. Understanding these KPIs empowers data-driven decisions, optimized processes, and stronger organizational outcomes. From employee engagement and training ROI to absenteeism rate and revenue per employee, these HR KPI examples illuminate your path to workforce success. Start unlocking your team's potential now.
1. Employee Turnover Rate
Employee turnover rate is a crucial HR KPI that measures the percentage of employees who leave an organization within a specific timeframe. This metric offers valuable insights into workforce stability, helps identify potential retention issues, and provides a snapshot of overall employee satisfaction. A high turnover rate can signify underlying problems within the organization, such as a negative work environment, lack of growth opportunities, or inadequate compensation, while a healthy turnover rate can indicate a thriving and engaging workplace. Tracking and analyzing this KPI is essential for building a strong, resilient, and successful organization. This makes it a must-have in any list of essential HR KPI examples.
The infographic above visually represents the employee turnover rate calculation using a flow chart. It demonstrates how the number of employee departures is divided by the average number of employees and then multiplied by 100 to arrive at the turnover percentage. This visualization clarifies the components involved in this essential HR KPI and simplifies the understanding of its calculation. The clear visual breakdown helps HR professionals grasp the process and apply it effectively within their organizations.
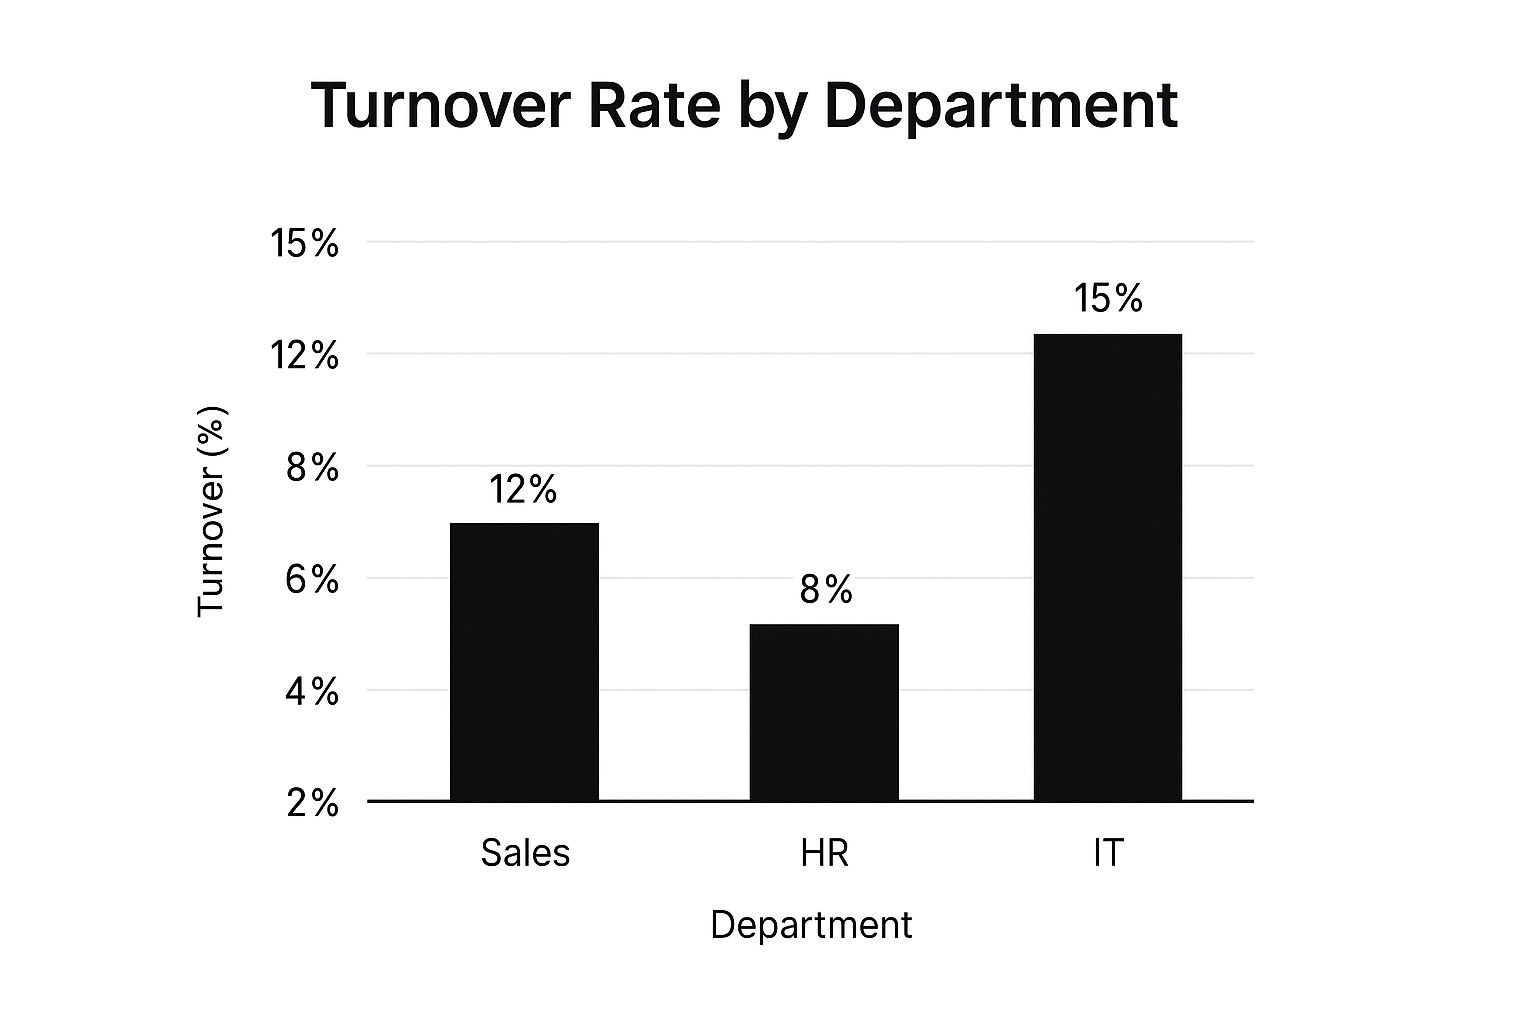
This KPI is calculated as (Number of departures / Average number of employees) × 100. It can be measured monthly, quarterly, or annually, and is often segmented by department, position level, or voluntary vs. involuntary turnover. This provides a more granular understanding of where turnover issues might be concentrated. For example, if the sales department consistently has a higher turnover rate than other departments, it signals a need for deeper investigation into the causes within that specific team.
Features and Benefits:
- Direct Correlation with Costs: Employee turnover directly impacts recruitment and training costs. A high turnover rate translates to increased expenses related to hiring, onboarding, and lost productivity. By monitoring this KPI, organizations can identify areas where they can reduce these costs and allocate resources more effectively.
- Early Warning System: The employee turnover rate acts as an early warning system for potential workplace culture problems. A sudden spike in departures can indicate underlying issues that need to be addressed promptly.
- Benchmarking: Turnover rates can be benchmarked against industry standards, providing context and allowing organizations to assess their performance relative to their competitors. This helps identify areas for improvement and best practices to emulate.
Pros:
- Directly correlates with recruitment costs and organizational stability.
- Helps identify departments or managers with retention issues.
- Provides early warning signs of workplace culture problems.
- Easy to benchmark against industry standards.
Cons:
- Doesn't explain why employees are leaving.
- Some turnover can be positive (e.g., removing low performers).
- Not all turnover has equal impact on the organization.
- Difficult to interpret without context (industry norms, company size, etc.).
Examples of Successful Implementation:
- Google: Maintains turnover rates below industry average through comprehensive benefits and growth opportunities.
- IBM: Uses predictive analytics to forecast turnover risks and implement preventive measures.
- Salesforce: Reduces turnover by emphasizing work-life balance and wellness programs.
Actionable Tips:
- Track voluntary and involuntary turnover separately to pinpoint specific issues.
- Combine with exit interview data to understand the root causes of employee departures.
- Set different targets for different departments based on industry benchmarks and specific needs.
- Monitor trends over time rather than focusing on single data points to identify patterns and predict future turnover.
When and Why to Use This Approach:
Employee turnover rate is a fundamental metric that should be monitored consistently by all organizations. It is particularly important during periods of change or uncertainty, such as mergers, acquisitions, or economic downturns. By tracking this KPI, HR professionals can proactively address potential retention issues, improve employee satisfaction, and ultimately contribute to the long-term success of the organization. This KPI is popularized by organizations like the Society for Human Resource Management (SHRM), industry analysts like Josh Bersin, and workplace research conducted by Gallup, further solidifying its importance in the field of human resources.
2. Time to Fill
Time to Fill is a crucial HR KPI that measures the efficiency of your recruitment process. It tracks the number of days it takes to fill an open position, starting from when the job requisition is approved to when a candidate accepts the offer. This metric provides valuable insights into how quickly your team can attract, assess, and onboard new talent. A streamlined Time to Fill translates to a more productive workforce and faster achievement of business goals. By optimizing this KPI, you're not just filling roles; you're fueling growth.

This KPI deserves its place in any HR professional's toolkit because it directly impacts both the bottom line and employee morale. Lengthy hiring processes can lead to lost productivity, project delays, and increased workload on existing employees. A quick and effective hiring process, on the other hand, keeps projects moving, boosts team morale, and strengthens your employer brand.
Features and Benefits:
- Measured in days or weeks: Provides a quantifiable measure of recruitment efficiency.
- Breakdown by category: Can be analyzed by position type, department, or seniority level for targeted improvements.
- Bottleneck identification: Pinpoints slowdowns in specific hiring stages (e.g., screening, interviewing, offer).
- Impact on operations: Directly influences business productivity and project timelines.
- Forecasting and budgeting: Enables accurate predictions of hiring timelines for better resource allocation.
- Cost-per-hire and ROI calculations: Supports data-driven decisions about recruitment investments.
Pros:
- Clear insights into recruitment efficiency.
- Helps forecast hiring timelines.
- Identifies inefficiencies in specific hiring stages.
- Enables cost-per-hire calculations and recruitment ROI.
Cons:
- Speed shouldn't compromise quality of hire.
- Doesn't always account for position complexity or market conditions.
- Can create pressure to rush the process.
- Can vary significantly based on industry, location, and role.
Examples of Successful Implementation:
- LinkedIn: Reduced Time to Fill by 43% using AI-driven candidate matching.
- Microsoft: Leveraged predictive analytics to optimize job posting timing and channels.
- Unilever: Decreased Time to Fill by an impressive 90% for entry-level positions through gamified assessments.
Actionable Tips for Optimization:
- Set realistic benchmarks: Establish different Time to Fill targets for various roles and levels.
- Stage-wise analysis: Break down the metric into individual stages (screening, interviewing, offer, etc.) to identify bottlenecks.
- Market awareness: Consider current market conditions when evaluating performance and setting targets.
- Industry benchmarking: Compare your Time to Fill against industry averages rather than arbitrary goals.
When and Why to Use Time to Fill:
Use this KPI to:
- Evaluate the overall effectiveness of your recruitment process.
- Identify areas for improvement within the hiring cycle.
- Track the impact of new recruitment strategies or technologies.
- Justify budget allocations for recruitment resources.
- Improve your employer brand by demonstrating a commitment to efficient hiring.
Popularized By: Gartner HR research, The Association of Talent Acquisition Professionals (ATAP), LinkedIn Talent Solutions
3. Cost Per Hire
Cost Per Hire (CPH) is a crucial HR KPI example that provides valuable insights into the financial efficiency of your recruitment process. It measures the average amount spent to fill a vacancy, giving you a clear picture of your return on investment (ROI) for every new hire. This powerful metric empowers organizations to optimize their recruitment strategies, make data-driven decisions, and ultimately, build a stronger workforce for less. Aspiring HR professionals, experienced specialists, and corporate HR teams alike can leverage CPH to demonstrate the value of their recruitment efforts and contribute to a healthier bottom line.
How Does it Work?
CPH is calculated with a straightforward formula:
(External costs + Internal costs) / Total number of hires
External costs encompass expenses like advertising on job boards, agency fees, and employee referral bonuses. Internal costs include the salaries of your internal recruiting team, the time spent by hiring managers on interviews, and the resources allocated to onboarding new hires. This comprehensive approach ensures you capture a true picture of your recruitment spend. Typically measured quarterly or annually, CPH can be further segmented by department, position level, or recruitment source for a more granular analysis. This allows you to pinpoint areas of strength and identify opportunities for improvement within specific teams or roles.
Features and Benefits:
- Clear ROI Measurement: CPH provides a quantifiable measure of the effectiveness of your recruitment activities.
- Budget Optimization: By understanding where your money is going, you can strategically allocate your recruitment budget for maximum impact.
- Channel Effectiveness: Identify the most cost-effective recruitment channels, whether it's employee referrals, social media campaigns, or university partnerships.
- Strategic Comparisons: Compare different hiring strategies to see which delivers the best results in terms of both cost and quality of hire.
Pros and Cons:
Pros:
- Provides clear ROI measurement for recruitment activities.
- Helps optimize recruitment budget allocation.
- Identifies cost-effective recruitment channels.
- Enables comparison between different hiring strategies.
Cons:
- Can incentivize cost-cutting at the expense of hire quality.
- Difficult to capture all indirect costs accurately.
- Varies significantly by industry, position level, and location.
- May not account for long-term value of quality hires. It's crucial to balance CPH with quality of hire metrics to ensure you're not sacrificing long-term talent for short-term cost savings.
Inspiring Examples of Success:
- Zappos: Reduced CPH by 47% by empowering their employees through an enhanced referral program. This fostered a culture of advocacy and significantly lowered recruitment costs.
- HubSpot: Lowered recruitment costs by leveraging content marketing to attract passive candidates. This innovative approach positioned them as an industry thought leader while simultaneously filling their talent pipeline.
- Deloitte: Optimized CPH through strategic university partnerships and early talent identification programs. This forward-thinking approach ensured a steady stream of high-potential candidates at a reduced cost.
Actionable Tips for Implementation:
- Comprehensive Cost Tracking: Include all relevant costs, including hiring manager time, onboarding expenses, and even the cost of software used in the process.
- Segmented Analysis: Calculate CPH separately for different position levels and departments to gain more specific insights.
- Balanced Approach: Balance CPH against quality of hire metrics like retention rate and performance reviews for a more holistic view.
- Channel Evaluation: Use CPH to evaluate the ROI of different recruitment channels and refine your strategy accordingly.
Why CPH Deserves Its Place on the List:
In today's competitive talent market, understanding your recruitment costs is no longer a luxury, but a necessity. CPH provides a powerful lens through which to analyze your recruitment efficiency, optimize your spending, and ultimately, build a high-performing team. By incorporating this KPI into your HR strategy, you'll be empowered to make data-driven decisions that positively impact your organization's bottom line and drive sustainable growth. CPH is popularized and recognized by influential organizations like SHRM and ISO 30414, as well as leading HR thought leaders like Dr. John Sullivan, further solidifying its importance in the field of human resources.
4. Employee Engagement Score
Employee engagement is the lifeblood of a thriving organization. It's the emotional commitment and connection employees feel towards their company and its goals, fueling their motivation and dedication. That's why tracking Employee Engagement Score is a crucial HR KPI example for any business aiming for peak performance. This metric provides valuable insights into your workforce's motivation, satisfaction, and alignment with company values, essentially measuring how invested your employees are in their work and the organization's success.
This KPI typically involves standardized surveys using 5- or 7-point Likert scales, combining multiple questions across various engagement dimensions. These dimensions can include factors like job satisfaction, relationship with management, belief in company values, and opportunities for growth. Regularly measuring employee engagement is crucial for understanding the effectiveness of your HR strategies. For proven frameworks and strategies to effectively gauge and improve engagement levels, explore resources like this guide on how to measure employee engagement. Source: Measure Employee Engagement: Strategies That Drive Results from Kirke Leadership. These surveys are usually conducted quarterly or annually and can be segmented by department, team, tenure, or demographics to pinpoint specific areas for improvement.
Why is this a top HR KPI example? Because engaged employees are more productive, stay with the company longer, and contribute to higher customer satisfaction. Measuring engagement helps you understand the health of your organizational culture, identify areas needing attention, and benchmark against competitors and industry standards.
Features and Benefits:
- Multi-faceted Measurement: Combines multiple questions across engagement dimensions for a holistic view.
- Regular Assessments: Conducted quarterly or annually to track progress and identify trends.
- Segmented Analysis: Allows for targeted interventions by analyzing data based on department, team, tenure, or demographics.
- Actionable Insights: Provides clear data to drive initiatives that boost engagement and overall performance.
Pros:
- Strong Correlation with Key Metrics: Directly linked to improved productivity, retention, and customer satisfaction.
- Cultural Health Check: Provides a valuable snapshot of the overall organizational culture.
- Targeted Improvement: Identifies specific areas where intervention can have the greatest impact.
- Benchmarking Capabilities: Enables comparison against competitors and industry best practices.
Cons:
- Survey Fatigue: Over-surveying can lead to low participation rates and inaccurate responses.
- Self-Reported Data: Relies on employee perception, which may not always align with actual behaviors.
- Requires Follow-Up: Action must be taken based on the results to maintain credibility and demonstrate value.
- Short-Term Influences: Can be affected by recent events, potentially skewing the overall long-term sentiment.
Examples of Success:
- Microsoft: Increased engagement scores by 18% through its growth mindset cultural shift.
- Salesforce: Maintains 90%+ engagement through its 1-1-1 philanthropy model and values-based culture.
- Johnson & Johnson: Uses pulse surveys and AI analysis to identify engagement trends and predictive factors.
Tips for Effective Implementation:
- Keep Surveys Concise: Focus on actionable dimensions to minimize respondent burden.
- Transparent Communication: Share results openly with all employees to build trust and foster collaboration.
- Action Planning: Develop concrete plans to address areas with low engagement scores.
- Strategic Frequency: Measure frequently enough to track trends but avoid survey fatigue.
By effectively utilizing the Employee Engagement Score KPI, organizations can cultivate a motivated, dedicated, and high-performing workforce, driving positive results across the board. This makes it an essential HR KPI example for organizations of all sizes. This KPI is often popularized by surveys and models such as the Gallup Q12, Aon Hewitt Engagement Model, Willis Towers Watson Employee Opinion Survey, and Culture Amp, giving you plenty of frameworks to choose from.
5. Training ROI: Proving the Power of Learning
Training ROI (Return on Investment) is a key HR KPI example that empowers you to demonstrate the tangible value of your learning and development (L&D) initiatives. It goes beyond simply counting training hours and delves into the financial impact, proving how investing in your people translates to business success. This makes Training ROI an indispensable tool for justifying training budgets, optimizing program effectiveness, and aligning L&D with overall organizational goals. This metric secures its place in the pantheon of essential HR KPIs due to its ability to speak the language of executives – the language of financial impact.
How it Works: Quantifying the Impact of Learning
Training ROI is calculated using a straightforward formula: [(Training benefits - Training costs) / Training costs] × 100. This calculation requires you to quantify both the costs and benefits associated with a specific training program or your entire L&D function. Costs are relatively easy to track, encompassing expenses like program fees, materials, instructor time, and technology. Benefits, however, can include both direct and indirect improvements, such as:
- Increased productivity and efficiency: Measure improvements in output, reduced error rates, and faster project completion times.
- Improved quality of work: Track reductions in defects, customer complaints, and rework.
- Higher employee engagement and retention: Analyze employee surveys, retention rates, and internal mobility.
- Enhanced leadership capabilities: Evaluate performance improvements, succession planning success, and team effectiveness.
- Reduced turnover costs: Calculate savings from decreased recruitment, onboarding, and training expenses for replacements.
Inspiring Examples of Training ROI in Action:
Several organizations have successfully leveraged Training ROI to demonstrate the impact of their L&D programs:
- IBM: Their Watson-powered learning platform personalized learning paths, resulting in a reported 300% ROI through increased employee performance and skill development.
- McDonald's Hamburger University: This iconic training program boasts a 40% higher promotion rate for graduates, a testament to its effectiveness and measurable ROI through internal talent development.
- Motorola: They meticulously calculated a $30 return in productivity gains for every $1 invested in training, solidifying the link between learning and financial performance.
Actionable Tips for Maximizing Your Training ROI:
- Define crystal-clear objectives: Before implementing any training program, establish specific, measurable, achievable, relevant, and time-bound (SMART) objectives.
- Utilize control groups: Whenever possible, compare the performance of employees who participated in training with a control group that did not, to isolate the training's true impact.
- Consider both short-term and long-term effects: Don't just focus on immediate productivity gains. Factor in the long-term benefits of skill development, career progression, and improved employee retention.
- Factor in reduced turnover costs: Include the financial benefits of reduced turnover, such as lower recruitment and onboarding expenses, in your ROI calculation.
Pros and Cons of Using Training ROI:
Pros:
- Demonstrates L&D's value in financial terms that resonate with executives.
- Helps prioritize training initiatives based on their impact and potential return.
- Identifies ineffective programs ripe for improvement or elimination.
- Supports data-driven decisions about future skill development investments.
Cons:
- Can be challenging to isolate training's impact from other contributing variables.
- Some benefits, like improved leadership skills or employee morale, can be intangible and difficult to quantify accurately.
- It can take time to realize the full ROI, especially for leadership development programs.
- May inadvertently lead to a focus on short-term, easily measurable outcomes, neglecting long-term development.
Influential Figures in Training ROI:
The concept of Training ROI has been significantly shaped by the work of:
- Donald Kirkpatrick: His Four Levels of Training Evaluation provide a framework for assessing training effectiveness.
- Jack Phillips: His ROI Methodology offers a structured approach to measuring the financial return on training investments.
- Association for Talent Development (ATD): A leading professional organization promoting best practices in talent development and training ROI measurement.
- Dr. Eduardo Salas: A renowned researcher whose work focuses on training effectiveness and measurement.
By embracing Training ROI, you transform your L&D function from a cost center into a strategic driver of business growth. You gain the power to justify investments, optimize programs, and showcase the transformative impact of learning on your organization's bottom line. This KPI is not just about numbers; it's about empowering your people and propelling your organization towards greater success.
6. Absenteeism Rate: Unlocking a Healthier, More Productive Workforce
Absenteeism rate is a crucial HR KPI example that provides valuable insights into the overall health and engagement of your workforce. By measuring the percentage of workdays lost due to unplanned absences, you can pinpoint potential problems, boost productivity, and cultivate a more engaged and thriving team. This metric deserves its place on the list of essential HR KPIs because it directly impacts operational efficiency and provides a window into employee well-being.
What is Absenteeism Rate and How Does It Work?
The absenteeism rate reveals the frequency with which employees are missing work due to unplanned sick leave, personal days, or unexplained absences. It's calculated as:
(Number of absent days / Total workdays) × 100
This calculation, typically performed monthly or quarterly, can be further segmented by department, shift, or even the type of absence. Importantly, it excludes planned vacations and approved time off, focusing solely on unplanned absences.
Why is Tracking Absenteeism Rate Important?
This KPI offers a powerful lens through which to view workforce reliability, potential health issues, and overall employee engagement. A high absenteeism rate can signal underlying problems ranging from burnout and stress to safety concerns or inadequate management practices. Conversely, a low and stable rate suggests a healthy, engaged, and productive workforce.
Features and Benefits:
- Quantifiable Impact: Directly correlates with productivity and operational costs, allowing you to measure the financial implications of absenteeism.
- Early Warning System: Provides insights into potential health, safety, or engagement issues before they escalate into larger problems.
- Identifies Trends: Tracking absenteeism over time helps identify patterns, such as seasonal spikes or recurring absences on specific days.
- Easy to Track: Simple calculation and readily available data make it easy to monitor and quantify the impact of interventions.
Pros:
- Directly correlates with productivity and operational costs.
- Helps identify potential health, safety, or engagement issues.
- Provides early warning of management problems or burnout.
- Easy to track and quantify impact.
Cons:
- Doesn't explain why employees are absent, requiring further investigation.
- Can inadvertently encourage presenteeism (coming to work sick) if not managed carefully.
- May be affected by seasonal factors like flu season.
- Different roles have varying operational impacts from absences.
Examples of Successful Implementation:
- Unilever: Reduced absenteeism by 22% by implementing a comprehensive wellness program.
- Toyota: Maintains low absenteeism through team-based accountability and flexible scheduling.
- Johnson & Johnson: Lowered absenteeism via preventive healthcare initiatives and stress management programs.
Actionable Tips for HR Professionals:
- Track Patterns: Analyze data for specific days, seasonal trends, or departmental variations to uncover root causes.
- Segment by Reason: Categorizing absences provides a more granular understanding of the driving factors.
- Consider the Bradford Factor: This metric helps differentiate between frequent short-term absences and less frequent long-term absences.
- Balance with Wellness Goals: Promote a culture of well-being that discourages presenteeism and encourages employees to prioritize their health.
Popularized By:
- Society for Human Resource Management (SHRM)
- Bradford Factor (developed at Bradford University School of Management)
- American Productivity & Quality Center (APQC)
- World Health Organization (WHO) workforce health metrics
By strategically using the absenteeism rate KPI, HR professionals can create a more engaged, healthy, and productive work environment, ultimately contributing to the organization's overall success. It’s a powerful tool for fostering a workforce that thrives both personally and professionally.
7. Revenue Per Employee
Revenue Per Employee is a powerful HR KPI that provides a high-level overview of workforce productivity and how effectively your human capital contributes to the bottom line. It deserves a place on this list of HR KPI examples because it bridges the gap between HR and core business objectives, offering valuable insights into operational efficiency and the financial impact of your workforce. By understanding and tracking this metric, HR professionals can play a more strategic role in driving organizational success.
What is Revenue Per Employee and How Does it Work?
This metric measures the average revenue generated by each employee. It's calculated by dividing the organization's total revenue by the number of full-time equivalent employees. This simple calculation reveals how much revenue each employee, on average, brings into the company. A higher revenue per employee generally suggests greater productivity and efficiency.
Features and Benefits:
- Calculation: Total Revenue / Number of Full-Time Equivalent Employees
- Measurement Frequency: Usually measured quarterly or annually.
- Benchmarking: Can be compared across departments, locations, or competitors.
- Insights: Provides high-level productivity and efficiency insights, connecting HR directly to business performance. This helps justify headcount decisions and resource allocation to senior leadership.
Pros:
- Simplicity: Easy to calculate and understand.
- Benchmarkable: Easily compare your organization's performance against industry standards and competitors.
- Strategic Alignment: Directly links HR to revenue generation, demonstrating the value of human capital.
- Actionable Insights: Helps inform strategic decisions related to staffing, training, and resource allocation.
Cons:
- Oversimplification: Doesn't account for different business models, capital intensity, or employee costs. A capital-intensive business might naturally have lower revenue per employee than a service-based business.
- Industry Variations: Cross-industry comparisons can be misleading due to significant variations in business models and revenue streams. Comparing a tech startup to a manufacturing giant isn't a like-for-like comparison.
- Potential for Misuse: Focusing solely on this metric can incentivize understaffing or overworking employees, negatively impacting employee well-being and long-term productivity.
- Profit Blind Spot: Doesn't consider profitability. A company could have high revenue per employee but still be unprofitable.
Examples of Successful Implementation:
- Apple: Maintains a remarkably high revenue per employee through high product margins and incredibly efficient operations. This demonstrates the power of premium branding and streamlined processes.
- Netflix: Achieves a high revenue per employee through technological leverage and automation, highlighting the impact of innovation and strategic investment in technology.
- Goldman Sachs: Utilizes revenue per employee to evaluate department performance and make informed decisions about resource allocation, showcasing how this metric can drive internal efficiency.
Actionable Tips for Aspiring and Experienced HR Professionals:
- Benchmark Smartly: Compare your organization's revenue per employee against direct competitors rather than across industries for a more accurate assessment.
- Focus on Trends: Track trends over time to identify areas for improvement and measure the impact of HR initiatives. Don't just look at the absolute numbers; analyze the trajectory.
- Holistic View: Consider revenue per employee alongside other metrics like profit per employee for a more comprehensive understanding of workforce performance.
- Context is Key: Adjust for different business models and industry nuances when benchmarking to ensure fair comparisons.
When and Why to Use This Approach:
Revenue Per Employee is particularly useful for:
- Assessing overall workforce productivity: Gain a high-level understanding of how efficiently your employees generate revenue.
- Justifying HR initiatives: Demonstrate the financial impact of HR programs and investments to senior leadership.
- Informing strategic workforce planning: Use data to make informed decisions about hiring, training, and resource allocation.
- Tracking the impact of organizational changes: Monitor the effect of restructuring, mergers, or new technology on workforce productivity.
Popularized By:
This important KPI has been highlighted by influential figures and organizations, including management consultant Peter Drucker, Harvard Business Review workforce productivity research, McKinsey Global Institute productivity studies, and Financial Times corporate efficiency rankings, further solidifying its relevance in the field of HR and business management. By embracing this metric, HR can step into a more strategic role, driving impactful change and contributing directly to organizational success.
8. Quality of Hire
Quality of Hire is a crucial HR KPI that goes beyond simply filling open positions; it measures the value new hires bring to your organization. It's about finding candidates who not only possess the required skills but also thrive in the company culture, contribute meaningfully, and stay for the long haul. This metric focuses on the long-term impact of successful recruitment, ultimately impacting your bottom line. Instead of just focusing on cost-per-hire or time-to-fill, Quality of Hire assesses the return on investment of your hiring efforts, making it a truly strategic HR KPI.

This KPI typically combines multiple metrics into a composite score, offering a holistic view of new hire success. These metrics can include performance ratings, time to productivity (often called "ramp-up time"), cultural fit, retention rates, and even hiring manager satisfaction. It’s usually measured after a predefined period, such as 90 days, six months, or a year, giving new hires time to acclimate and demonstrate their capabilities. The score is often calculated as a percentage or on a 0-100 scale.
Why Quality of Hire Deserves Its Place in Your HR KPI Arsenal:
In today's competitive talent landscape, securing top talent is paramount. Quality of Hire provides a direct link between recruitment efforts and business impact. By focusing on value, this KPI helps justify investments in robust recruitment processes, sophisticated selection tools, and comprehensive onboarding programs. It’s a powerful tool for elevating the strategic role of HR within an organization.
Features and Benefits:
- Comprehensive Evaluation: Moves beyond basic metrics to assess the overall contribution of new hires.
- Long-Term Focus: Encourages strategic hiring decisions that prioritize long-term value over short-term gains.
- Data-Driven Improvement: Provides valuable data to refine selection methods and optimize the recruitment process.
- Increased Accountability: Holds recruiters and hiring managers accountable for the long-term success of their hiring decisions.
Pros:
- Focuses on value rather than just cost or speed of hiring.
- Helps evaluate and improve selection methods.
- Creates accountability for long-term hiring outcomes.
- Connects recruitment directly to business impact.
Cons:
- Complex to define and measure consistently.
- Requires a waiting period to assess accurately.
- Influenced by factors beyond recruitment (onboarding, management).
- Can be subjective without clear performance metrics.
Examples of Successful Implementation:
- Google: Improved quality of hire by 29% through its structured interview process and data-driven selection.
- Procter & Gamble: Achieves high quality of hire through assessment-based selection and culture-fit evaluation.
- Facebook: Uses "bootcamp" onboarding to quickly assess new hire potential and optimal team placement.
Actionable Tips for Measuring and Improving Quality of Hire:
- Define Quality Standards Before Hiring: Establish clear criteria and expectations for new hires based on the specific role and company culture.
- Include Both Performance and Cultural Adaptation Metrics: Evaluate both hard skills and soft skills to get a comprehensive picture of a new hire's contribution.
- Gather Input from Multiple Stakeholders: Solicit feedback from peers, managers, and even clients to gain a broader perspective on a new hire's performance and integration.
- Track the Correlation Between Selection Methods and Quality Outcomes: Analyze which recruitment methods are most effective at identifying high-quality candidates.
Popularized By:
Influential figures like Lou Adler (hiring expert and author) and Dr. John Sullivan (talent management expert), along with impactful research like Google's Project Oxygen and insights from LinkedIn Talent Solutions, have all contributed to the growing recognition of Quality of Hire as a key HR KPI.
By incorporating Quality of Hire into your HR strategy, you can transform your recruitment process from a reactive function to a proactive driver of organizational success. This crucial hr kpi examples element provides a powerful framework for attracting, selecting, and retaining top talent that contributes significantly to your company's growth and overall performance.
8 Key HR KPI Comparison
| KPI | Implementation Complexity 🔄 | Resource Requirements ⚡ | Expected Outcomes 📊 | Ideal Use Cases 💡 | Key Advantages ⭐ |
|---|---|---|---|---|---|
| Employee Turnover Rate | Low – simple calculation | Low – relies on HR records | Insights on workforce stability and retention issues | Organizations monitoring employee retention | Early warning on culture problems, easy benchmarking |
| Time to Fill | Medium – requires tracking multiple stages | Medium – involves recruiting teams | Measurement of recruitment efficiency and timelines | Hiring process optimization and bottleneck removal | Clear recruitment insights, forecasts hiring timelines |
| Cost Per Hire | Medium – needs cost data collection | Medium – includes various recruitment expenses | Financial efficiency of hiring | Budget planning and optimizing recruitment channels | Measures recruitment ROI and cost control |
| Employee Engagement Score | Medium – survey design and deployment | Medium – survey tools and analysis | Measures employee motivation and satisfaction | Enhancing culture, motivation, and retention | Strong link to productivity and retention |
| Training ROI | High – complex measurement and evaluation | High – data collection, analysis | Financial impact of training investments | Justifying and prioritizing L&D programs | Demonstrates training value in financial terms |
| Absenteeism Rate | Low – straightforward calculation | Low – attendance tracking systems | Indicates workforce reliability and health issues | Managing attendance and wellness programs | Early identification of burnout or management issues |
| Revenue Per Employee | Low – simple financial calculation | Low – financial and headcount data | Overall workforce productivity and efficiency | Business performance evaluation and benchmarking | Links HR metrics to business outcomes |
| Quality of Hire | High – combines multiple metrics | High – requires performance data collection | Value and effectiveness of recruitment | Improving selection and onboarding processes | Focus on long-term hire value and business impact |
Taking Your HR Strategy to the Next Level
This article has explored a range of essential HR KPI examples, from classic metrics like employee turnover rate and cost per hire to more nuanced indicators such as employee engagement score and quality of hire. By understanding and actively tracking these KPIs, you gain invaluable insights into the health and effectiveness of your HR initiatives. Remember, these aren't just numbers; they represent the people who drive your organization forward. Mastering these HR KPI examples allows you to pinpoint areas for improvement, optimize your processes, and ultimately, create a more engaged, productive, and fulfilling workplace for everyone. This translates directly to better business outcomes, a stronger company culture, and a competitive edge in today's dynamic market. By leveraging the power of data-driven decision-making, you can truly transform your HR function from a reactive support system to a proactive strategic partner.
Ready to elevate your HR expertise and unlock your full potential? The Global Human Resource Institute offers comprehensive certification programs designed to deepen your understanding of HR KPI examples and other critical concepts. Visit Global Human Resource Institute to explore our programs and empower yourself to lead the future of HR.


0 Comments